Profiling
--profile shows where a program spends its time and its memory, and what calls what - as a website you open in a browser, with a call graph, a table of every function, a flame graph and the heap. It runs the program's @main, its benchmarks and its tests, and each can be looked at on its own. Every call and every allocation is counted exactly, and every function's time is measured by sampling.
Profiling a project
--profile runs @main, when there is one, then the @bench and @test functions in no stage. Like --bench and --test, --profile=slow,e2e takes those in the stages it names as well, and --profile-all every one. What follows -- is @main's arguments.
The site goes in .refingere/profile in the project's folder, or the folder out= names. It's a single page, with the viewer and the profile in it, that opens straight from disk - no server, nothing loaded from the internet, no file beside it to read - so it can be attached to an issue or kept next to a change it measured:
Two runs
The program runs twice, compiled twice, and the site puts both runs together:
- The sampling run is compiled as usual and runs under Bun's sampling profiler, which records several thousand times a second which functions are running. That gives each function's time - how long it ran itself, and how long with what it called - and which function was running under which. Sampling doesn't slow the program down, so the times are the program's own.
- The counting run is compiled so that every function reports each call to the profiler: who called it, and how many times - and the runtime reports every block of memory allocated, and every garbage collection. Those counts are exact. Reporting each call does slow the program down, which is why its times aren't used. It's always compiled to WebAssembly, whatever the target: only the WebAssembly runtime can count what it allocates (see Memory).
Because the program runs twice, whatever it does happens twice - its output appears twice, and it writes files or sends requests twice. Profile with replacements for the outside world, as a test would (see Testing), or a copy of the data it changes.
A benchmark is called over and over for about a second in the sampling run, so there are enough samples to show where its time goes, and once in the counting run - so its calls are those of a single call. A test is called over and over for about a tenth of a second in the sampling run, so even a quick one has samples, and once in the counting run. @main runs once in both. An entry that ends in an error is reported with FAIL, as a test is, and the command exits with status 1.
The site
On the left is everything that was profiled - @main, each benchmark and each test, with its time and its number of calls - and Everything, all of them together. Pick one to see only what it did. At the top are its totals: the time sampled, the number of samples, the number of calls and of functions.
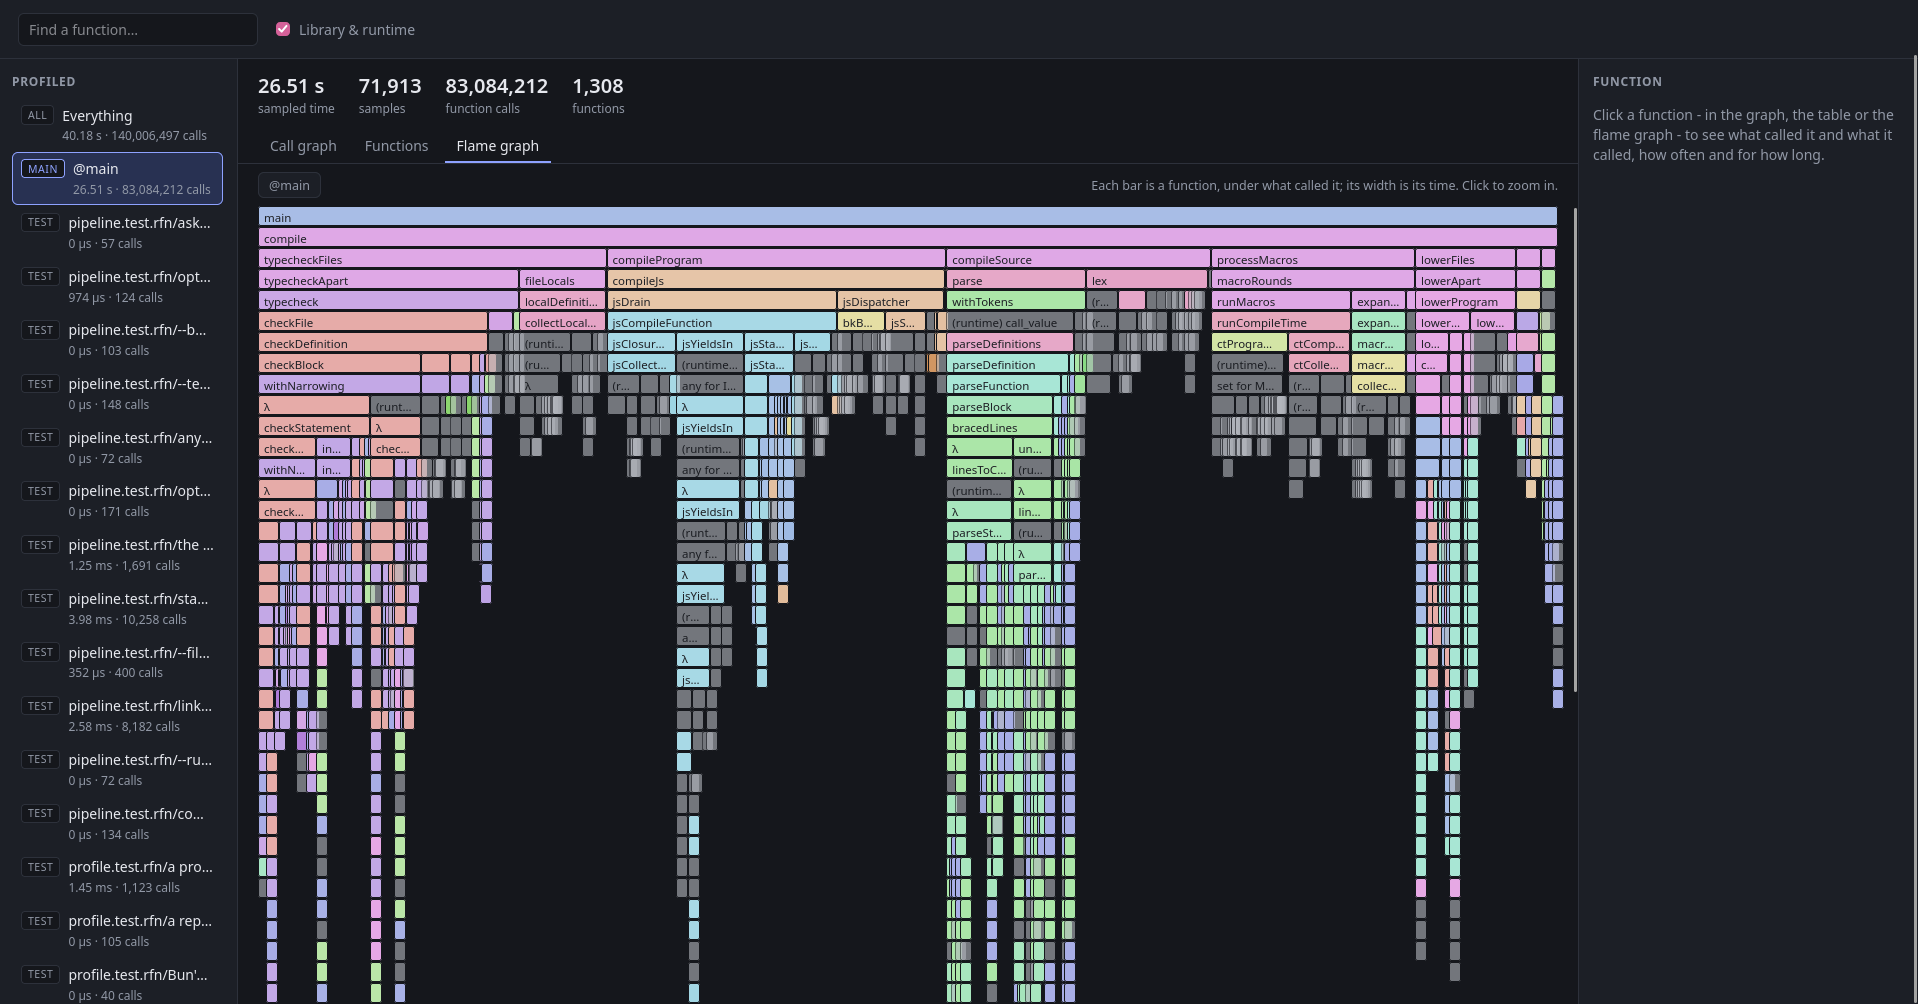
@main's flame graph, with Library & runtime on. Call graph
Each box is a function, with where it's defined, its share of the time - its own (self) and with what it called (total) - and how many times it was called. The bar on its left goes from blue to red with its own share of the time. An arrow is a call: from the caller down to what it called, labelled with how many times (×354) and how long it took. Its thickness and colour are its share of the time - or, with Edges by calls, of the calls. A function calling itself has a loop beside it, and a call back up to a function still running - recursion through others - is dashed, on the side.
The graph shows the functions that took the most time, 30 of them to begin with - Functions shown changes how many. Drag to move it and scroll to zoom. Click a function to light up its calls; double-click it - or Focus the graph on it - to see just it, what called it, and what it calls two levels down.
Functions
Every function, with its own time, its total time and its calls, sortable by any of them. Click a column's heading to sort by it, and a row to see that function's details.
Flame graph
Each bar is a function, under what called it, as wide as the time it took there - so a wide bar is where time goes, and the bars on it show what it went to. The colour is the file it's in; the darker, the more of the time was its own. Click a bar to zoom into it; the path above takes you back out.
A function's details
On the right, the selected function: its time and calls, then every function that called it and every function it called, each with how many calls and how much time. Click one to go to it.
Library and runtime
By default the site shows the program's own functions. Library & runtime adds the standard library's functions and the runtime's own work - garbage collection, operators, method dispatch - each as (runtime) .... Hidden, their time counts as the time of the program's function that called them.
Memory
Measure, at the top, switches the site from time to memory. Then everything weighs bytes allocated instead of time: the call graph's boxes and arrows, the table - with each function's own allocations beside its bytes - and the flame graph, where a bar is as wide as the memory allocated under it. A function's own memory is what it allocated itself; its total, with what it called. Memory the library and the runtime allocate - an array growing, a text being built - counts as their caller's, unless Library & runtime is on.
At the top are the totals: the memory allocated, in how many blocks, how many collections ran, the most a collection found still in use, and what was kept after. For that last one the counting run collects garbage just before each entry and just after it, once its result has been let go: what the collection after finds in use, less what the one before did, is what the entry left behind. A test that should leave nothing behind and keeps memory has a leak:
Its profile shows the thousand orders as kept after, and the Heap tab shows them piling up: the memory in use after each collection, along the memory allocated so far - every entry one after another, with a dot where each ended. A line that keeps climbing is memory that's kept; a sawtooth that comes back down is memory that's used and let go. The counting run collects after every MiB allocated, more often than a program usually does, so even a small program has points to show.
What's kept isn't always a leak: a const is made the first time it's read, and stays, so the entry that reads it first keeps it - and an entry that fills a cache it means to keep keeps that. A benchmark's memory is that of one call, as its calls are. The numbers are WebAssembly's: with --target=js, the times are JavaScript's, and the memory is a WebAssembly build's - a JavaScript engine lays values out its own way, so the bytes differ there, but which function allocates the most, and what's kept, carry over. For what a single call allocates, measured over many calls, see Benchmarking.
What's counted
Every named function and method is counted, the library's included. A λ isn't: what it calls counts as called by the function it was called from - for map's λ, the function that called map:
An @async function, or one that yields, is counted when it's called. What it does after an await or a yield counts as called by whatever resumed it - usually the runtime's task runner, shown with Library & runtime. The sampled times don't have these limits: a λ's time is its caller's, and an async function's time is its own. Memory goes by the same calls as the counts: what a λ allocates is its caller's.
The compiler built in Refingere
The refingere command takes the same --profile, --profile=... and --profile-all, and runs the program itself - there's no need for --run. The site goes in .refingere/profile in the program's folder, or profile in --out, with the compiled modules and the raw profiles beside it in profile-run. Its counting run is WebAssembly too, with --js. Its functions are shown without line numbers - the intermediate language it compiles from doesn't keep them.